You can look at one IVF success rate and see a low percentage per egg collected, then look at another and see a much higher percentage per embryo transfer. It can feel as though one of them must be wrong.
Usually, neither is.
Each percentage starts counting at a different point. A live birth rate per egg retrieved begins with every egg collected. A live birth rate per egg collection looks at the whole collection procedure. A live birth rate per embryo transfer begins later, once an embryo has already reached transfer.
That difference matters because an egg still has to fertilise, develop and become suitable for transfer before pregnancy can begin. A percentage measured from embryo transfer leaves those earlier stages outside the calculation.
Once you can see where each percentage begins, the figures stop contradicting each other. They start answering different questions.
The three IVF success rates are measuring different things
A live birth rate per egg retrieved starts with each individual egg collected. It follows that egg through fertilisation, embryo development, transfer, implantation and pregnancy.
A live birth rate per egg collection starts with the retrieval procedure as a whole. It looks at whether that collection eventually led to a live birth, sometimes including more than one embryo transfer from the same group of eggs.
A live birth rate per embryo transfer starts much later. It includes only embryos that developed far enough to be transferred.
This is why the percentage per embryo transfer is usually higher. It begins after several earlier stages have already been completed. The percentage per egg retrieved begins before any of them have happened.
What live birth rate per egg retrieved means
A live birth rate per egg retrieved starts with every egg collected during retrieval.
It then follows each egg through every stage that comes after: fertilisation, embryo development, transfer, implantation and pregnancy.
That is why this percentage is much lower than the live birth rate per embryo transfer. It includes eggs that do not fertilise, embryos that stop developing and embryos that never reach transfer.
The figure also changes with age. A percentage that may be reasonable for one age group can be far too high for another.
So an average of around 8% per egg retrieved may be useful in a worked example, but it should not be read as your personal chance from each egg.
What live birth rate per egg collection means
A live birth rate per egg collection starts with the retrieval procedure, rather than with each individual egg.
It asks whether that collection led to a live birth.
The important detail is whether the figure includes only the first embryo transfer or all fresh and frozen transfers created from that collection.
When all transfers are included, the result is a cumulative live birth rate per egg collection. This gives a fuller picture of what one retrieval produced overall.
So before comparing clinic figures, check whether the percentage is based on the first transfer only or on every transfer from the same collection. They are not measuring the same thing.
What live birth rate per embryo transfer means
A live birth rate per embryo transfer starts with the embryo placed in the uterus.
It does not include the eggs that did not fertilise or the embryos that did not develop far enough to be transferred.
That is why this percentage is higher than the live birth rate per egg retrieved. It begins later, after several earlier stages have already been completed.
It can be useful when you want to know what happened once an embryo reached transfer. It cannot tell you what one egg collection produced overall.
One egg collection can produce three different success rates
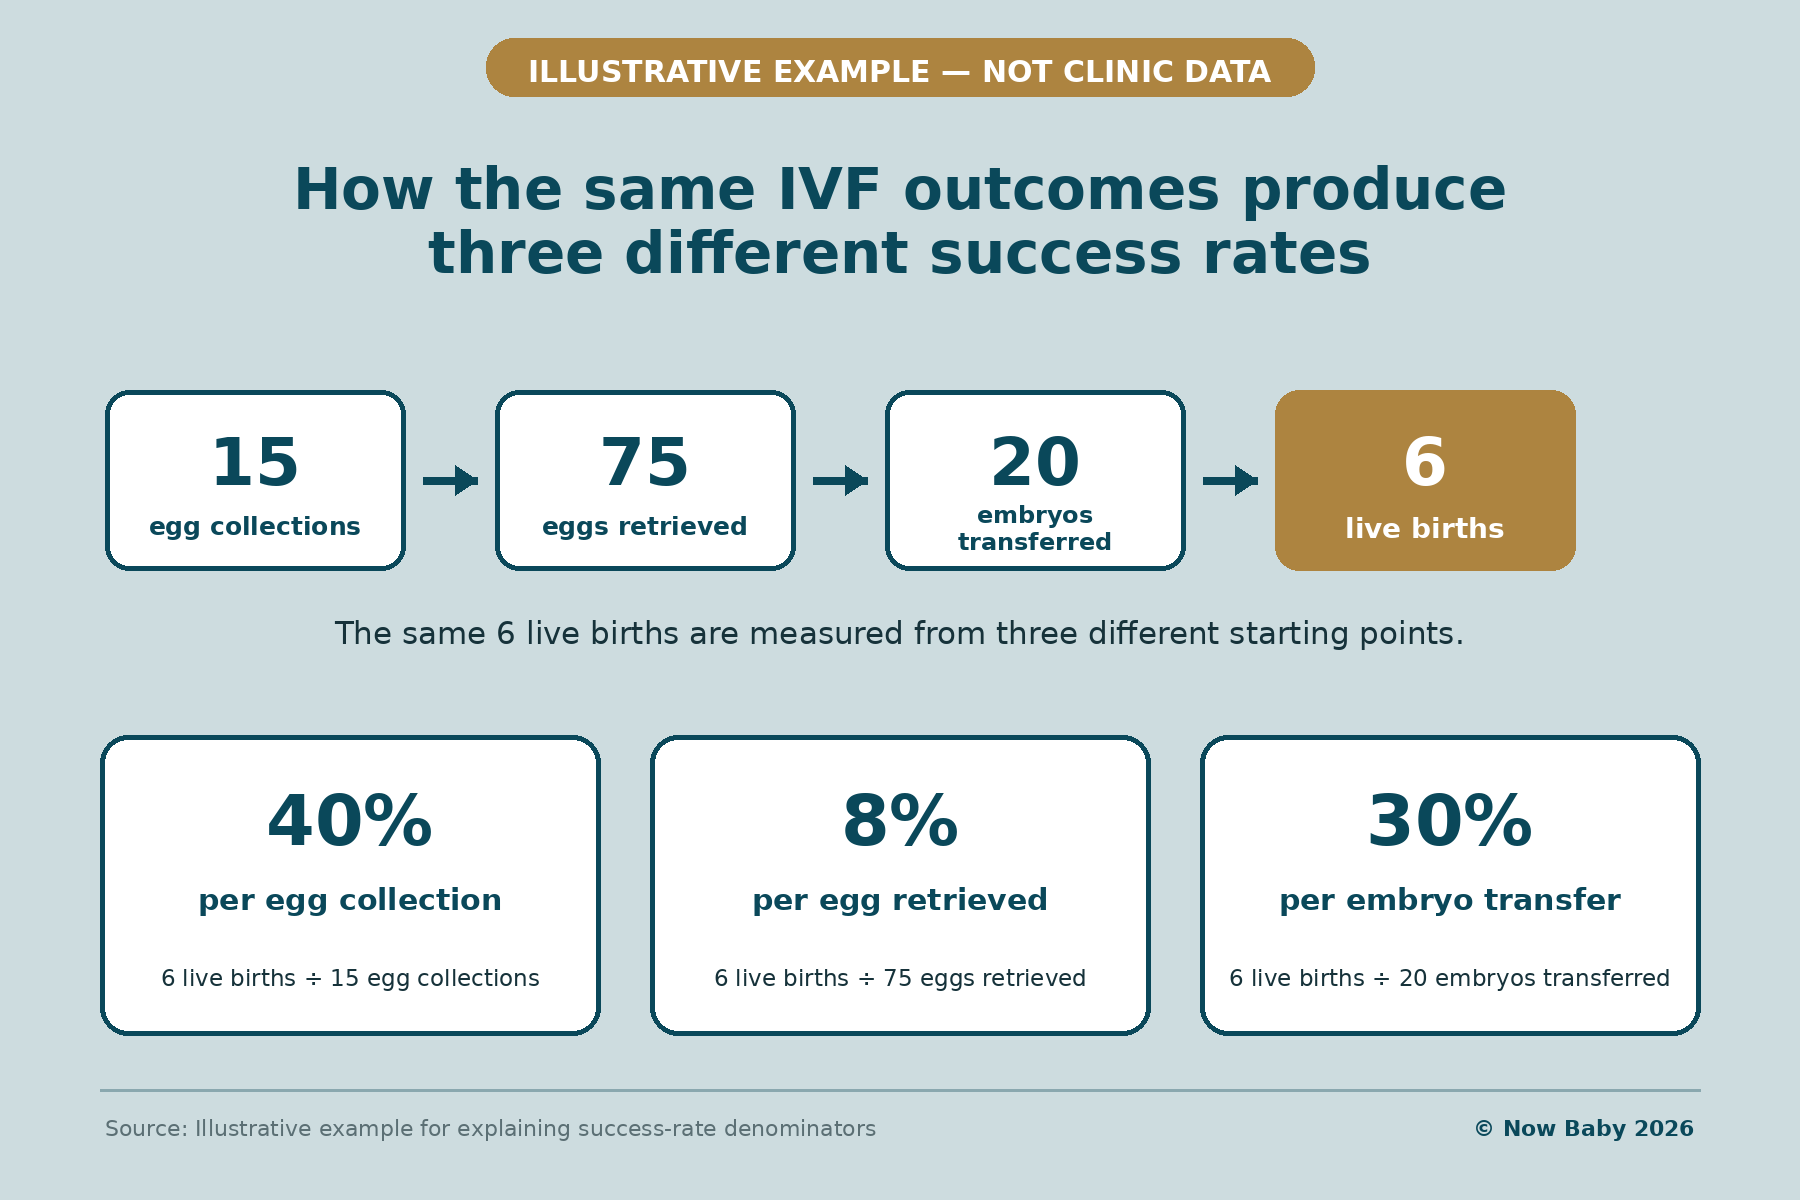
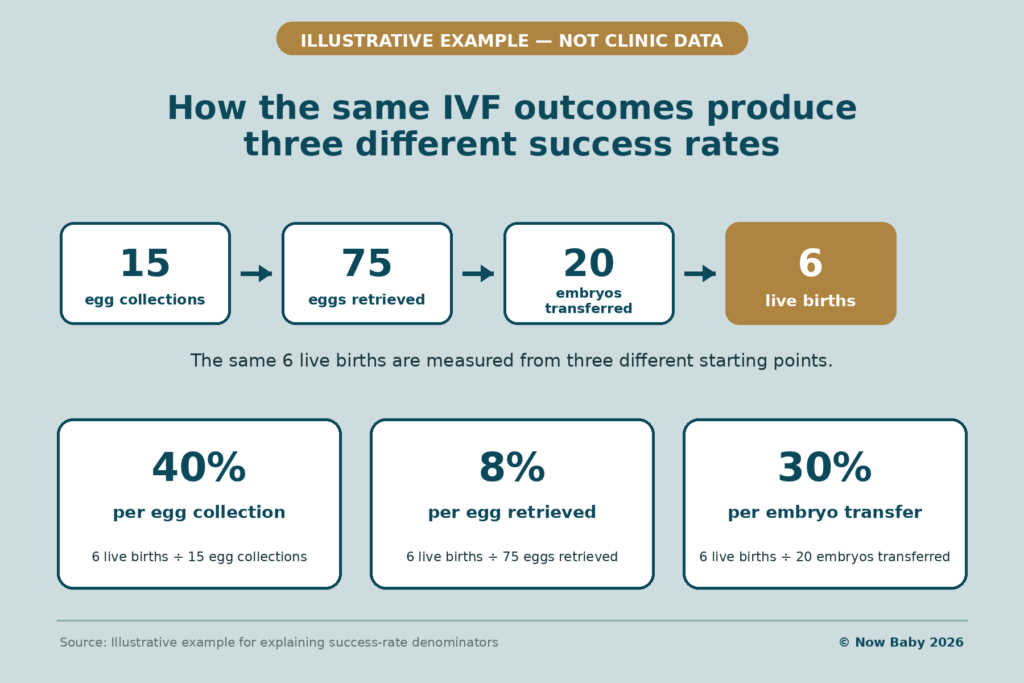
Take one simplified example:
- 8% live birth rate per egg retrieved
- 40% cumulative live birth rate per egg collection
- 30% live birth rate per embryo transfer
These percentages are describing the same IVF pathway from different starting points.
The 8% begins with every egg retrieved.
The 30% begins only when an embryo reaches transfer.
The 40% looks at the egg collection as a whole and includes the chance of a live birth across all the embryos transferred from it.
That percentage can be higher than the rate per embryo transfer because one egg collection may produce more than one opportunity for transfer.
The figures have not changed because the treatment became more or less successful. The percentage changes because the starting point changes.